
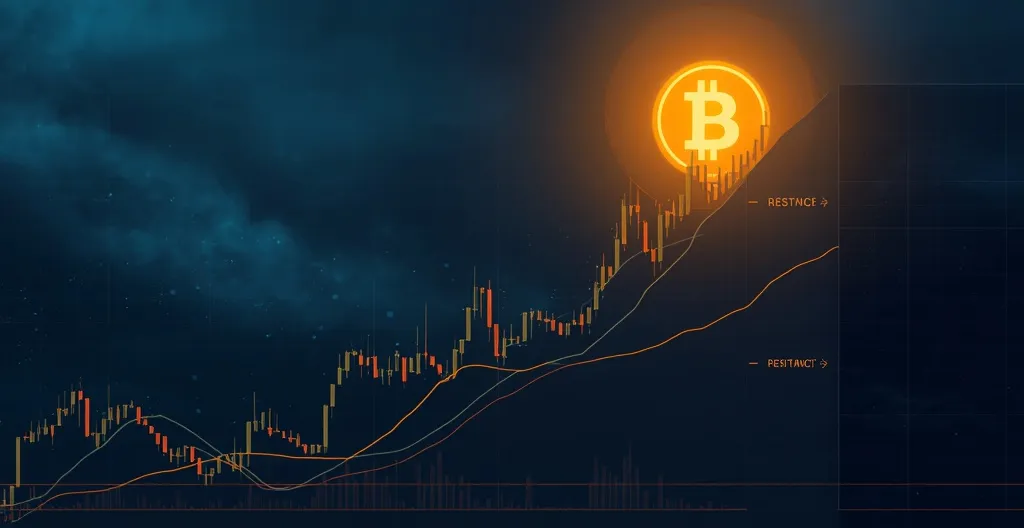
Bitcoin is creeping toward a classic bullish technical signal, but the chart still has some work to do. The setup looks better after the August rebound, yet BTC keeps banging into the same stubborn resistance near $80, 000, $82, 000.
- Golden cross: nearing, but not fully confirmed
- BTC price: around $79, 250
- Main resistance: $80, 000, $82, 000
- Key support: $75, 900, then the low $72, 000s
Bitcoin has recovered sharply from a June low of about $58, 000 and, according to the price levels being tracked, recently moved from around $63, 000 to above $80, 000 before stalling. That rebound has pulled Bitcoin’s medium-term moving averages closer together, which is why traders are now watching for a potential golden cross.
For readers who do not live inside chart screens, a golden cross pattern is a bullish pattern that usually refers to a shorter-term moving average crossing above a longer-term one, most commonly the 50-day moving average above the 200-day. Traders love it, talk about it nonstop, and often treat it like a green light. It is also a lagging indicator, which means it confirms momentum that has already built rather than predicting some magical future price move.
That matters here because the numbers do not support blind celebration. The 200-day moving average is near $72, 830, the 100-day is around $70, 560, and the 50-day is close to $70, 210. In other words, the trend lines have tightened after the rebound, but this is not a clean “golden cross confirmed and the moon is booked” situation. The market still needs to prove it can keep pushing higher.
Bitcoin’s latest attempt topped out around $81, 500 before sellers dragged price back toward $79, 000. That is the real story. Not the fancy label. Not the chart meme. The market has repeatedly struggled in the $80, 000, $82, 000 zone, and until BTC can break that ceiling and hold above it, the rally remains constructive but incomplete.
A daily close above $82, 000 would go a long way toward clearing the local resistance and could open the door to about $85, 000. If that does not happen, Bitcoin could keep chopping around the same range while traders argue over whether the next move is breakout or exhaustion. Markets love a good emotional hostage situation.
Momentum has cooled enough to leave room for another push. The Bollinger Bands, a volatility tool used to spot when price is stretching too far in either direction, have not turned this into a cartoonish blow-off yet. The Relative Strength Index, or RSI, a momentum gauge that often starts to look overheated above 70, has eased from overbought conditions to about 62. That suggests buyers still have some gas in the tank without the market looking obviously stretched.
The first important support sits near $75, 900. If BTC loses that level, the bullish case starts to weaken fast. Below that, the 200-day moving average around $72, 800 becomes the next major reference point. A break under that area would make the whole golden-cross narrative a lot less impressive and a lot more like traders trying to dress up a weakening trend with a shiny technical label.
That is the part people often skip over. Moving averages are useful, but they do not lead the market. They follow it. A golden cross can confirm improving medium-term momentum, but it does not force price higher. Bitcoin still has to absorb supply, clear resistance, and hold those gains instead of flicking up for a few candles and falling back into the same range.
The broader takeaway is straightforward: Bitcoin’s chart has improved, but it is not resolved. The rebound from June has repaired sentiment and brought trend indicators into a tighter formation. Still, the next few moves around $80, 000, $82, 000 will decide whether this turns into a cleaner breakout or just another volatile pause before the market picks a direction. For a similar setup from earlier in the cycle, see how Bitcoin Golden Cross and ETF Inflows Signal Bullish momentum got traders buzzing while context still mattered.
Key questions and takeaways
-
Is Bitcoin’s golden cross confirmed?
Not yet, based on the moving-average levels being watched. The setup is getting closer, but the crossover still needs to fully confirm on the chart. -
Why do traders care about a golden cross?
It is a widely watched bullish signal that can confirm improving momentum. But it is a lagging indicator, so it reflects strength that has already developed. -
What level matters most right now?
The $80, 000, $82, 000 resistance zone is the key battleground. A daily close above $82, 000 could improve the odds of a move toward $85, 000. -
Where is Bitcoin’s nearest support?
The first important support is around $75, 900. If that fails, the 200-day moving average near $72, 800 becomes the next major area to watch. -
Is momentum overextended?
Not obviously. RSI has cooled to about 62 from overbought levels, which suggests bullish momentum is still present without looking extreme.
Bitcoin has improved enough to keep bulls interested, but not enough to hand them a trophy. The setup is better. The proof still has to come from price. And if history is any guide, this is the point where everybody starts pretending they knew the next move all along.
Further reading
A few more takes on Bitcoin’s next move, for anyone tracking the same resistance zone from different angles.